Benefit from the same method that ensures that Quality, Service, Value and Extra Credit are a part of every fee conversation with FDI’s Value and Fee Benchmark with FEEPOINT® calculation Presentation Style Report.
.png)
Data Matters
All data is current, accurate and consistent with 408(b) disclosures because it comes directly from the people who know the plan best – its Service Providers.
Patented Method
FDI patent #8510198 covers the 5 step process below that is fair, repeatable and an important part of a Fiduciary’s obligation to follow a prudent process for determining fee reasonableness.
.png)
.png)
1: Custom Benchmark Groups by Service Provider
Groups are built so that:
- Factors that drive service provider cost are considered
- All datapoints are statistically meaningful with outliers removed
- Diversification across service providers, business models and market segments
2: Framework to Consider Quality
Frameworks include:
- Characteristics of the Service Provider
- Services/Processes that make a plan relationship successful
- People/Technology/Resources that support the plan
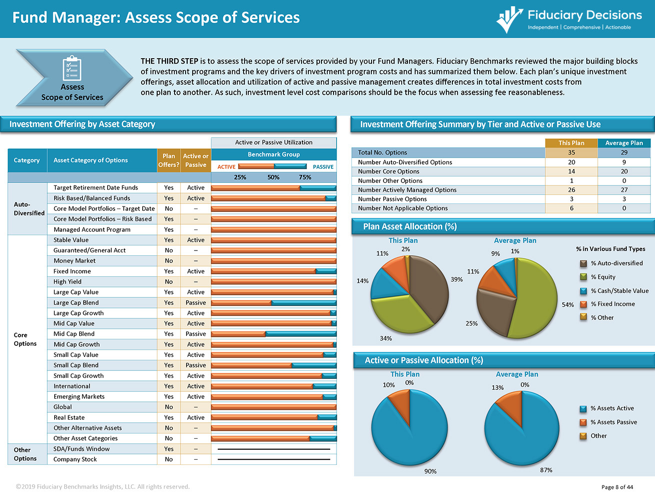
3: Assess Scope of Services
Scope evaluated to:
- Identify core services being provided to the plan
- Analyze services that drive plan costs based on volume and degree of difficulty
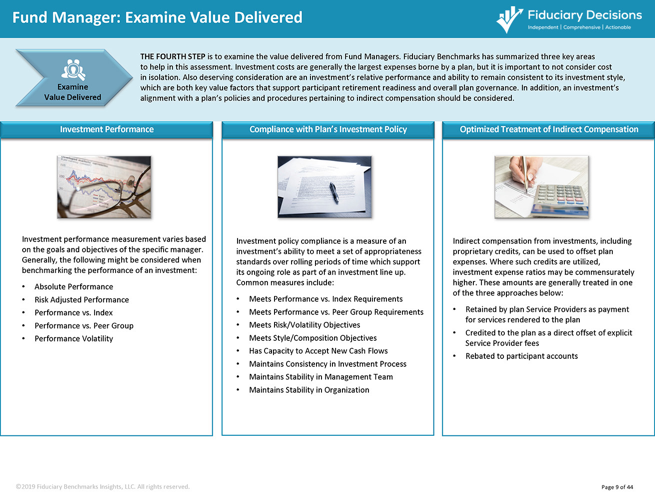
4: Examine Value Delivered
Value received by:
- Plan Sponsors
- Service Quality
- Plan Design Assistance
- Utilizing Best Practices
- Participants
- Retirement Outcomes
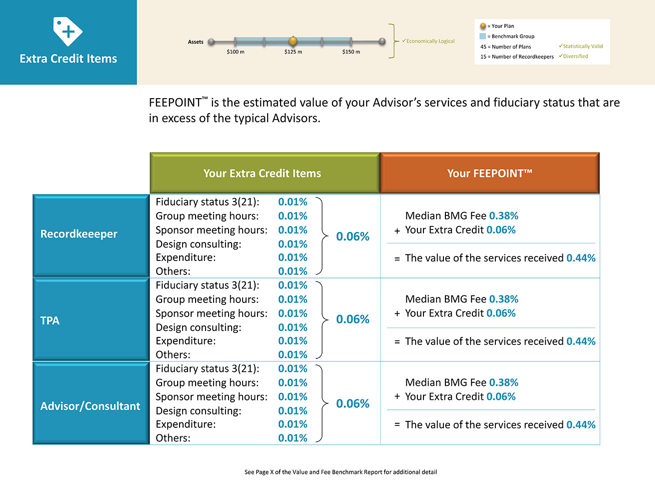
5: Allow for Extra Credit
Extra Credit calculated by:
- Starting with a base Service Provider fee for a standard level of service
- Adjusting for incremental fiduciary status and/or extra work/meetings
Report Format
.png)
Presentation Style Value and Fee Benchmark with FEEPOINT® calculation Report
2 pages per service provider – “what you get” and “what you pay” covering a summary of the 5 components of benchmarking. The details and calculations are delivered in a separate PDF
- Executive summary format
- Excellent for client and prospect plan reviews
- Average of 10 pages